 English
/
English
/  Japanese
English
/ Japanese
eAPI is available from EOS4.12.0.
You can put the EOS CLI command remotely by JSONPRC over HTTP.
Then you get the response message as JSON format too.
In shorut, eAPI can proceed around 180 commands per a second.
A simple "show version" command executed in 5.5ms.
Following report is the measured response time of eAPI as one of the case studies.
Note : This experiment had been done on my lab. environment only. Please don't treat the numbers as a generic / absolute / typical result. It is just one example.
Yutaka Yasuda (Arista Square)
24/June/2013 : First release. Test had been done by 7048T switch with EOS 4.12.1.
1. Introduction
1.1 Abstract of eAPI
1.2 Getting started
2. Evaluation : Measurement of the Response Time
2.1 Method of Evaluation
2.2 Equipment Configuration and Running Enviromnment
2.3 Points to be checked
2.4 Measurement Result and Analysis
3. Conclusion
eAPI is an application interface to able to execute EOS CLI commands on the switch remotely by using JSONRPC over HTTP/HTTPS. Then you can get the result or response message from the switch as JSON format. The command needs to be formed as JSONRPC 2.0 parts and you can tell it by HTTP or HTTPS to your Arista switch. The result or response message is also formatted as JSON data. It means you do not have to hassle to parse or scrape by yourself.
eAPI is one of key features to make Arista as a part of SDN (Software Defined Network) but it is different from OpenFlow. Cause OpenFlow does only treat forwarding table ("flow-entry" as a term of OpenFlow) related issue but eAPI can access to all features of Arista such as port configuration and optional software installation. I suppose you can control the upgrading process of the EOS itself remotely. (There might be some restrictions for some kind of safeguard.)
eAPI is served as JSONRPC over HTTP/HTTPS. It means when you turn on eAPI, your Arista box would be a Web server. After that, when you access the IP address of the switch by your browser, you will see the Command API explorer such as Fig. 1. (Before you see that, you need to give registered username and password of the switch to pass the Basic Authentication process.)
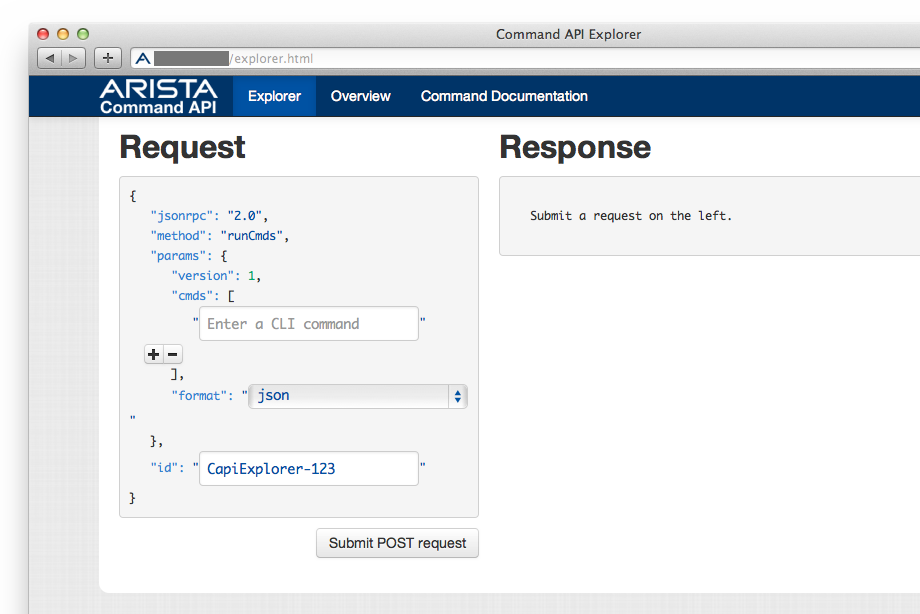
Fig. 1. Command API Explorer
Command API Explorer is very useful tool. It shows the format of the eAPI request and the response. It will help you to write and debug an eAPI client application.
Additionally, it includes eAPI documents in the "Overview" and "Command Documentation" menus on the top of the explorer screen. Fig. 2 shows the result when you execute "show version" command.
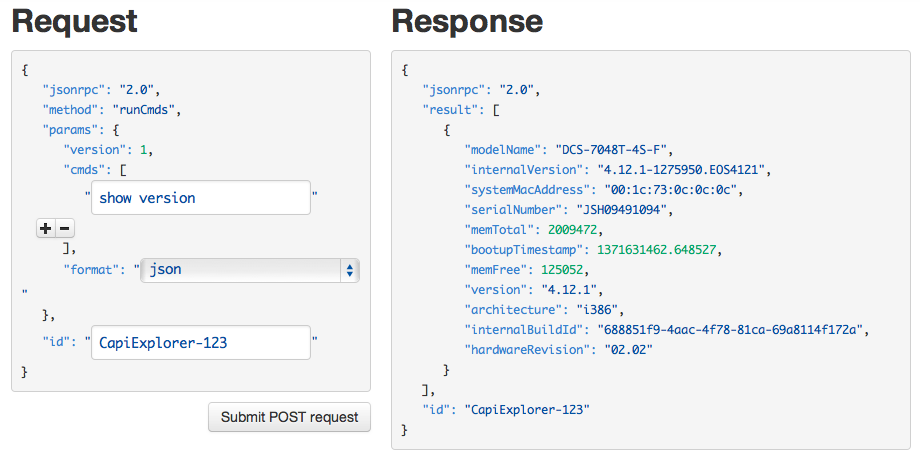
Fig. 2. Result of Show Version Command
You can see the result is formed as JSON data. When you get the result, you just pass the result to existing JSON parser and you specify the key (such as "version") then get the target value (such as "4.12.1" ) in easy.
Here are the example of operations to start eAPI. I did it by following eAPI: Learning the basics. Operations are simple and easy as follows;
localhost#config localhost(config)#management api http-commands localhost(config-mgmt-api-http-cmds)#protocol ? << HTTP/HTTPS are available http Configure HTTP server options https Configure HTTPS server options localhost(config-mgmt-api-http-cmds)#protocol http % Cannot enable HTTP and HTTPS simultaneously <<< As default, HTTPS is already running localhost(config-mgmt-api-http-cmds)#no protocol https <<< stopping HTTPS localhost(config-mgmt-api-http-cmds)#protocol http <<< select HTTP (again, and it works now) localhost(config-mgmt-api-http-cmds)#no shutdown <<< start the service localhost(config-mgmt-api-http-cmds)#
eAPI is running now. To enable eAPI automatically after the next boot, don't forget write current configuration down to memory.
localhost#write memory localhost#
From EOS CLI, you can see the status of the service as follows;
localhost(config-mgmt-api-http-cmds)#show management api http-commands Enabled: Yes HTTPS server: shutdown, set to use port 443 HTTP server: running, set to use port 80 VRF: default Hits: 1 Last hit: 139 seconds ago Bytes in: 0 Bytes out: 0 Requests: 0 Commands: 0 Duration: 0.000 seconds URLs -------------------------------------- Vlan12 : http://192.168.11.111:80 <<< EOS shows the URL to access Management1 : http://xxx.xxx.xxx.xxx:80 <<< This is also the activated URL too localhost(config-mgmt-api-http-cmds)#exit localhost(config)#
When you access to the above address such as http://192.168.11.111:80, the Basic Authentication dialogue will come up.
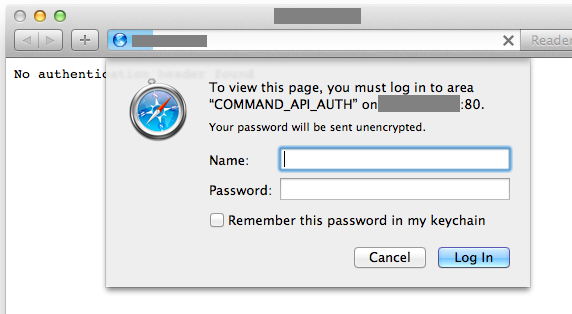
Fig. 3. Authentication Dialogue
After you put the valid username and password of the target switch, the Command API Explorer will come up such as Fig. 1. If you want to execute the privilege command, you need to use the username which has right role attribute.
Take attention please this is only the one of experiments. I did this on my switch only and there is no guarantee the results of all switches would be the same.
I have checked the simple eAPI response time, that means the elapsed time from the starting of the communication to finishing the result receiving. eAPI can handle multiple commands in the single JSONRPC request. Hence I checked how total elapsed time will be increasing in such situation. I used "show version" as an indicator of this measurement cause it is the light weight command. Particularly, I was throwing the following request to Arista.
As single command request {"id":0,"method":"runCmds","params":{"cmds":["show version"],"format":"json","version":1},"jsonrpc":"2.0"} As multiple commands request {"id":0,"method":"runCmds","params":{"cmds":["show version","show version","show version"....],"format":"json","version":1},"jsonrpc":"2.0"}
Fig. 4 shows the evaluation environment of this experiment. I used a 7048T switch with EOS 4.12.1. And I chose HTTP for easy debugging but in real operation, HTTPS would be normal choice. Client machine was the MacBook Air (2012 model, Sandy Bridge) and it connected to the LAN through the USB-Ethernet adapter. Almost of the paths to the server (Arista) were using Gigabit Ethernet therefore this USB-Ethernet was only one 100Mbps path and it was the lowest part of the route. (But it did not make any large impact to the result of this experiment because the measurement of the response time was based on the millisecond order.)
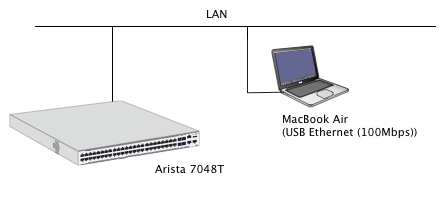
Fig. 4. The Structure of the Experiment
The benchmark program as a client had been written in Java and it uses JSON-RPC 2.0 library.
For more detail of the software, see [ eAPI benchmark program for Java ].
There are some points to be checked to make the measurement accurate enough. It needs to ensure these points didn't make any large effect to the measurement.
Sytem.nanoTime() had been used for the measurement. [ see the detail ]. Hence I have checked the accuracy of the System.nanoTime() by following the document "Java performance measurement, is it okay to use that timer?" (in Japanese). The code in this blog showed the number of delay time on my Mac but it included only 0 and 1000nsec (1usec) value. Original document says he have got the various numbers of delay but I didn't, probably it depends on the hardware, OS and Java runtime. 1000 times loop of System.nanoTime() calling takes 97000ns ( 97usec ). Therefore it shows the single System.nanoTime() runs in 97ns but the resolution is only 1000ns. Anyhow, it is good enough accuracy to measure the millisecond based events of this experiment.
Ping showed 0.5ms or around between the client and the server (Arista). It means the round trip time would make delay time in the range of that.
$ ping 192.168.11.111 PING 192.168.11.111 (192.168.11.111): 56 data bytes 64 bytes from 192.168.11.111: icmp_seq=0 ttl=64 time=0.446 ms 64 bytes from 192.168.11.111: icmp_seq=1 ttl=64 time=0.571 ms ....
The benchmark program uses JSONRPC 2.0 library and Authenticator.setDefault() for the Basic Authentication. It works well for the Basic Authentication process but internally, it sends POST request without any Authorization header at first, then it would be refused as 401 authorization fail, after that, it re-sends the same POST request with Authorization header automatically. (It is normal behavior as the Web access.) Therefore, the benchmark program [ see the detail ] measures this double HTTP POST processing time.
If this double process makes a large delay, it will hide the real eAPI response time. So I made it sure. In concrete form, I checked the time stamp of the packets of that two POST request and response packets. Here is the result. It shows the important packets and these time stamps and interval time in millisecond. For example, 21.102 means the packet appears 21.101 sec after the capturing had been start.
time int packet description ======= ===== ==================================== 21.102 ( 0) : The first POST request packet, with no Authorization: header 21.104 ( 2) : The response of 401 authorization fail 21.108 ( 4) : The second POST request, with Authorization: header 21.292 (184) : The response of 200 OK, It takes 180ms processing time
The result shows the first POST request and the response of Authorization fail takes only 2ms or around. Then the second POST request would be sent several milliseconds later. And it took 180ms or around to do the real eAPI processing. It means the total response time was almost occupied by the true eAPI processing time.
Fig. 5 shows the response time when the program put "show version" command by JSONRPC over HTTP. The X axis means the number of packed commands. 1 means the case of the one JSONRPC request included only single "show version" command. 10, 20, 30 and 40 means the case of the multiple commands had been packed in single request. The Y axis means the response time in millisecond. The dots had been plotted with delta offsets randomly in X direction to show the concentration of the results.
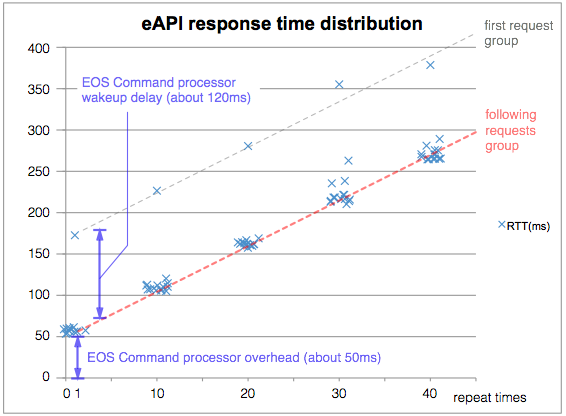
Fig. 5. eAPI response distribution
First of all, the graph is very linear. But there are single outstanding late response in each group of number of packed commands. These trials are all the first time access after some interval from the last access. (to be described below)
Now please consider about the red dotted line, it excludes the first accesses. It shows two things. One, all trials have about 50ms latency in common. It looks an overhead to invoke the EOS command processor. And the other one is the linear growing depends on the number of packed commands. It looks an accumulated value of the pure processing time of each "show version" command.
From the result and several checked points,
As above, each "show version" had been executed in 5.5ms (220ms / 40).
In Fig. 5, there are single outstanding late response for each group. These trials are all the first time access after some interval from the last access. The first eAPI access always has more delay. It indicates the EOS command processor will be in the low priority or the sleep status a while, then it needs this latency to back to the processing status.
To examine the source of this delay, whether it comes from the Arista's web server program or EOS command processor, I have checked the latency of the each stage of the communication by my own tool "geturl". It is tiny C program that reports the elapsed time of TCP connection, GET request and data accept completion as follows; (In this case, all accesses would make an authorization fail response. But if the delay is caused by Airsta's web server, the response of this request will be also delayed.)
The execution of the first time (after the some interval (30sec or more) from the last access) $ geturl -tv http://192.168.11.111/ done : 2013/06/21-11:26:01.82 : CONNECT 0.549 msec : GET 3.448 msec : FILE 0.470 KB : Avg. 1090487 bps $ Repeated execution, with interval of 1sec or around. done : 2013/06/21-11:26:03.61 : CONNECT 0.412 msec : GET 3.018 msec : FILE 0.470 KB : Avg. 1245858 bps done : 2013/06/21-11:26:05.71 : CONNECT 0.402 msec : GET 3.208 msec : FILE 0.470 KB : Avg. 1172070 bps done : 2013/06/21-11:26:07.59 : CONNECT 0.365 msec : GET 3.098 msec : FILE 0.470 KB : Avg. 1213686 bps done : 2013/06/21-11:26:09.51 : CONNECT 0.417 msec : GET 3.171 msec : FILE 0.470 KB : Avg. 1185746 bps done : 2013/06/21-11:26:11.45 : CONNECT 0.362 msec : GET 3.092 msec : FILE 0.470 KB : Avg. 1216042 bps done : 2013/06/21-11:26:13.34 : CONNECT 0.351 msec : GET 3.083 msec : FILE 0.470 KB : Avg. 1219591 bps done : 2013/06/21-11:26:15.24 : CONNECT 0.394 msec : GET 2.600 msec : FILE 0.470 KB : Avg. 1446154 bps ....
It had been tried several times but all showed the same results, around 3ms delay. In the above case, the first access looks have a little bit longer delay but it limited in 0.5ms. It is clearly unrelated with the 120ms delay. That means the source of 120ms first access delay is the startup overhead of EOS command processor. Low priority or some?
It is possible to use the keep alive technique to omit the first access delay. It can avoid to create the new JSONRPC session for each request. Actually, JSONRPC 2.0 library seems to set the Keep Alive option to their request header. Here is the HTTP POST request header.
POST /command-api HTTP/1.1 Accept-Charset: UTF-8 Content-Type: application/json User-Agent: C/YasuTest Host: 192.168.11.111:80 Accept: text/html, image/gif, image/jpeg, *; q=.2, */*; q=.2 Connection: keep-alive Content-Length: 118 Authorization: Basic WjdWu7DwjD2xhw9Di
But against it, eAPI server process refuses the Keep Alive request and terminates the session, obviously. Here is the HTTP response header for the above POST request.
HTTP/1.0 200 OK Server: BaseHTTP/0.3 Python/2.7 Date: Fri, 21 Jun 2013 09:58:51 GMT Cache-control: no-store Cache-control: no-cache Cache-control: must-revalidate Cache-control: max-age=0 Cache-control: pre-check=0 Cache-control: post-check=0 Pragma: no-cache Set-Cookie: COMMAND_API_SESSION=0; Path=/ Content-type: application/json Content-length: 542 Connection: close
It seems there is no way to make the efficiency higher by the effort of the client side.
Here are the results of the study;
It is 10 times or more faster than the traditonal command processing way, by using ssh login and command scraping or call Cli from EOS's shell script. (EOS CLI shell needs 1sec or more to startup.) eAPI is very practical, and it makes Arista programmable.
Consequently 2. and 3. issues above, it is better to pack multiple commands in the single JSONRPC request as you can.
In the future, if it can handle the Keep Alive feature to make faster response, it can have more practical usability.
In addition, please note it is meaningless to compare this result to the delay time of OpenFlow simplistically. For example, as a wrong judgement, "OpenFlow can set the flow entry in a few milliseconds but eAPI takes at lest 50ms then it is slow." But OpenFlow can only treat forwarding table ("flow-entry" as a term of OpenFlow) but eAPI can access to all feature of Arista such as port configuration and optional software installation. I suppose you can control the upgrading process of the EOS itself remotely. (There might be some restrictions for some kind of safeguard.)
Don't misunderstand. SDN gives the controllability not only about the path configuration.